


Next: Visualisation as a tool
Up: Basic visualisation methods
Previous: Depth perception
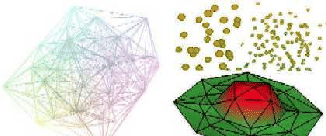
It is quite simple to display the mesh itself. It is just as hopeless as it is unnecessary to achieve a complete comprehension of an irregular, perhaps even tetrahedral mesh. However, it is possible and sufficient to render the nodes as points or small objects to show the node density distribution, element edges as lines to give an impression of the structure, or element faces as polygons to show the bounding surface. All of the methods to help depth perception described above can be used. As all of the discrete data is associated to mesh components, the display of the mesh is the basic tool to show simple data like discrete local parameters or concentration values. These may be coded as the colour, size or width of the displayed objects.
Figure 3:
Mesh nodes (poor depth perception), mesh edges (overstuffed image), and a bounding surface made up of mesh polygons
 |
Szecsi Laszlo
2001-03-21