


Next: Isosurface
Up: Basic visualisation methods
Previous: Visualisation as a tool
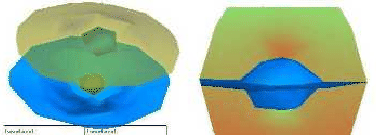
The easy way to simplify the three-dimensional problem is to select a plane to investigate. In order to display data along such a chosen cross-section, the points where the plane intersects the edges of the elements should be determined. The values there are given by the interpolation of nodal values along the edges. Then, for every element, the intersected polygon can be drawn. If the colours at the vertices represent the values on a linear scale, the linear interpolation of the colour performed by OpenGL when rendering the polygon will make the image match the real approximate solution.
Figure 4:
Isosurface and cross-section image displaying hydraulic pressures around a lens of confining material
 |
Szecsi Laszlo
2001-03-21