Spot noise is a simple and effective algorithm to visualize vector fields. Originally proposed for visualizing two-dimensional flows or flows on surfaces, it is also easily extendible to three dimensions. However, images resulting from a straightforward extension of spot noise to 3D are rather cluttered and confusing, they do not show the underlying flow too well and are also missing any indication of flow orientation. The latter is also an inherent drawback of two-dimensional spot noise. In this paper we outline several strategies to improve visualizations of both two- and three-dimensional vector fields with spot noise. These include orientation indication by anisotropic spots, sorted spots and depth cueing for better depth perception, and colour coding strategies.
Keywords: flow visualization, 3D, spot noise, splattingTexture synthesis is used in many application areas, ranging from computer arts to virtual environments and scientific visualization. Often, textures are useful to give an impression of the nature and properties of data. Especially in scientific research, vector fields are frequently needed to describe information, and it is also desired to find a proper way of visualizing them. Vector fields are used in many disciplines, for example to describe the distribution of pressure and velocity over a ship hull or a plane. Other applications include magnetic fields, wind movements or currents in oceans and rivers.
A very simple approach to vector field visualization is to draw a grid, pick some vectors and display them using arrows or similar symbols. While these so-called arrow plots may be sufficient to give an impression of very simple vector fields, it is obvious that they lack a lot of the original information, and such visualizations become almost useless if the vector field is more complex.
More sophisticated flow visualization algorithms include, e.g., stream lines [10] in 2D, illuminated stream lines [18], stream ribbons and tubes [12], stream balls [1], and stream surfaces [6] in 3D. However, these techniques use a sparse distribution of visualization items which possibly miss important feature of the flow. Texture based techniques, on the other hand, employ dense visualizations to avoid these drawback.
We discuss related work on dense visualizations of vector fields in Section 2. Section 3 is about improvements of spot noise for visualizing 2D flow whereas in Section 4 we outline extensions to visualize 3D flow. In Section 5 additional results are given and we conclude in Section 6.
A standard algorithm for visualizing two-dimensional vector fields is line integral convolution (LIC) [2]. LIC has the disadvantage that flow speed and orientation cannot be perceived. One algorithm which avoids these drawbacks is oriented LIC (OLIC) [16] which uses a sparse input texture and therefore possibly misses small details. The thick oriented stream-line algorithm (TOSL) [14] achieves the same results with dense visualizations.
A straightforward extension of LIC to three dimensions yields a box showing the flow on its faces as the input texture is completely opaque. Attempts to overcome this situation include interactive clipping planes [13] and again a sparse input texture with several extensions to enhance the visualization [7, 8]. However, LIC in three dimensions is rather inefficient and difficult to handle to get meaningful visualizations.
On the other hand, spot noise [15] is a straighforward technique which randomly distributes spots with orientation and scaling according to vector field direction and magnitude over the two-dimensional domain with random intensities, thereby effectively revealing the underlying flow. Scaling of the spots results in a visualization of flow magnitude. Enhanced spot noise [5] achieves better quality by spot bending and spot filtering.
Max et al. [11] use small texture mapped dots stretched in the direction of the flow to visualize flow near surfaces.
They exploit that uni-coloured spots require no sorting. To avoid cluttering, spots that are very close to the surface or farther away from it are faded out. Crawfis and Max [3] use small line segments oriented according to the flow and composited with a scalar function in order to render three-dimensional scalar and vector fields simultaneously. In another paper, Crawfis and Max [4] use textured splats, that are enhanced with scratch marks, oriented accoring to the flow. In the following we will outline several strategies to enhance spot noise visualizatzions first in two-dimensional flow, then in three-dimensional flow.

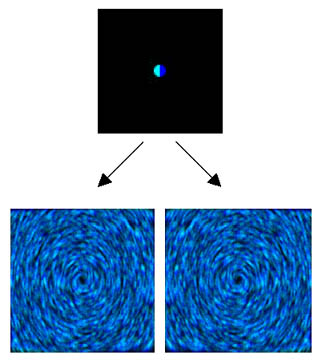
Figure 1: By differently coloring front and back-facing parts of the spot the orientation of the circular flows becomes apparent.
Although, as opposed to LIC, spot noise visualizations of 2D vector fields show not only flow direction but also flow magnitude, they do not depict flow orientation. For example, in a circular vector field it is impossible to tell whether the flow runs clockwise or counter-clockwise. Here we give two simple methods to also depict flow orientation within spot noise images.
Usually, the spots in spot noise for visualizing vector fields are isotropic and black and white, resulting in ambiguities in flow orientation. To address this problem different spots are needed. On the other hand the common disc-shaped spots provide good results, so a suitable approach is to use coloured discs, with the 'front' of the spot in one colour and the 'back' in another. An example with circular flows is shown in figure 1. It is clearly visible that the flows go in opposite directions, but are otherwise the same.
Another way to depict flow orientation is to use spots that are anisotropic in shape. For example, a spot which is wider the in direction it is facing and with a thin tail in the direction it is coming from is also capable of showing flow orientation. However, if too many spots are drawn, resulting in a dense texture, this effect is diminished. A sparse coverage of the 2D domain is desirable, resulting in images similar to OLIC. As spots should not be placed too densely in 3D to avoid occlusions, we will show its applicability to reveal flow orientation in 3D in Section 4.8.
As in 2D, there are also many three dimensional applications where vector fields are used and have to be visualized. There are several ways to accomplish this, and the best one to choose strongly depends on the kind of information you are interested in.
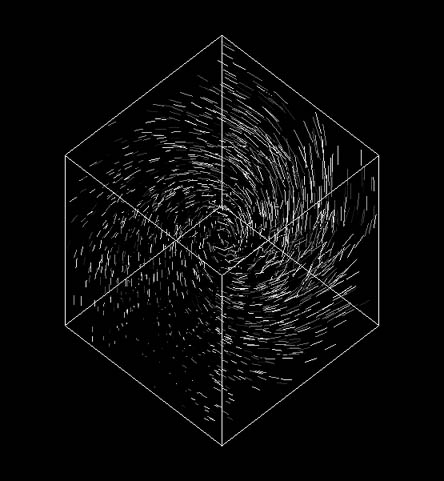
Figure 2: A fast preview mode, which draws simple lines oriented and scaled according to the projected vectors, allows for the first insights into the flow.
Sometimes it is desirable to display information very quickly, instead of producing high-quality results, for example if you just want to get an overall impression of data, or try out different viewing angles. A very fast and easy way to accomplish this is to draw simple lines at random positions in the 3D space. These lines can be rotated so that they represent the direction of the vector at the chosen position, and the vector length can be visualized by varying the length of the lines. This is similar to the approach by Crawfis and Max [3]. This 'preview mode' is shown in figure 2 and in some cases might just be enough to provide the desired information about the underlying data. In these pictures, the intensities of the lines are chosen randomly to provide more contrast, but have no other meaning.
3D spot noise can quite easily be done by placing spots in a 3D space instead of a plane. In this straightforward approach the spot noise algorithm almost stays the same:
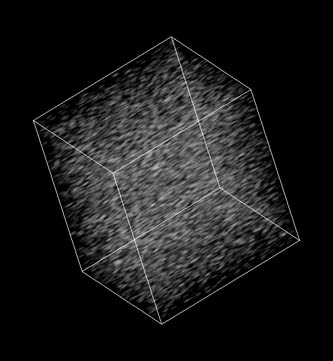
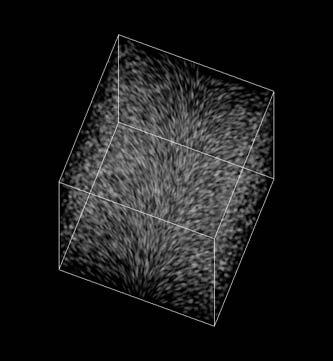
Figure 3: Straightforwardly extending spot noise to 3D (by randomly placing spots in 3D space, oriented and scaled according to the underlying flow with random intensities) often produces rather cluttered images.
A random position in space is calculated and the vector information is read from the underlying dataset. The vector is then projected onto the viewing plane, and the resulting two-dimensional direction and length is used to scale and rotate the spot. This means that not the actual vector information is used, but rather the way it looks like on the viewing plane. For example, a vector that points straight away from the eye point appears to have length zero on the viewing plane and is therefore drawn without any scaling, no matter how long the vector really is. Just like in two-dimensional spot noise, a large number of spots is drawn at random locations and blended together. The intensities of the spots are also chosen randomly. Figure 3 shows vector fields visualized with this method. However, the disadvantages here are that it does not give a very good three-dimensional impression of the data, and that in some cases too much information may overlap and produce confusing results.
The previous results can be improved by drawing spots back-to-front, which gives a better three dimensional impression and is also suitable for more complex vector fields. In this approach similar to splatting [17], spot noise is performed in planes parallel to the view plane and blended together back-to-front. The concept can be seen in Figure 4, example images with improved depth perception in Figure 5.
Often only areas with big vector lengths (e.g. high velocities) are of interest and need to stand out of the surrounding area. This can be done by drawing areas with low vector lengths more transparent, or by even omitting data below a certain threshold, as suggested by Jobard et al. for 2D unsteady flow [9]. An example in 3D can be seen in Figure 6.
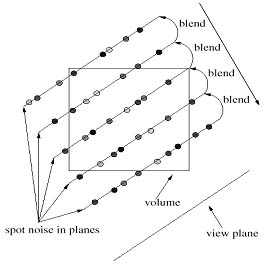
Figure 4: Sorted spots (by traversing the volume back-to-font, performing spot noise in planes, and blending them together) yield better depth perception.
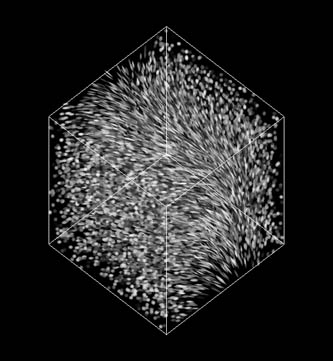
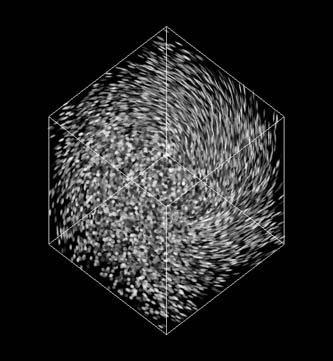
Figure 5: Improved depth perception by sorted spots.
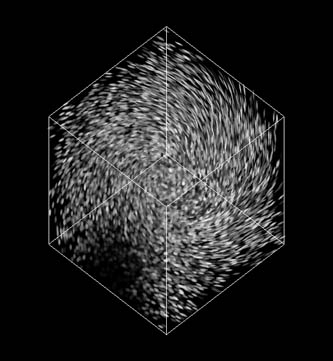
Figure 6: A 3D velocity mask makes regions with low velocities, which are often less important, transparent.
Vector length can even be more emphasized by using colour to draw spots differently depending on the underlying vector. In Figure 7 a transfer function is used (depicted on top, normalized) that maps vectors with length zero (i.e. no flow activity at this point) to blue and vectors with maximum length to red. In these pictures it is very easy to distinguish 'slow' and 'fast' areas.

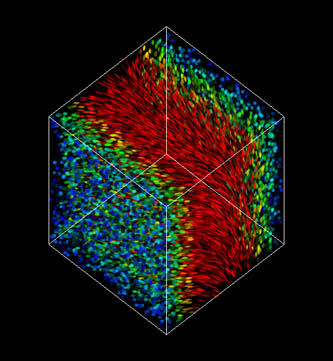
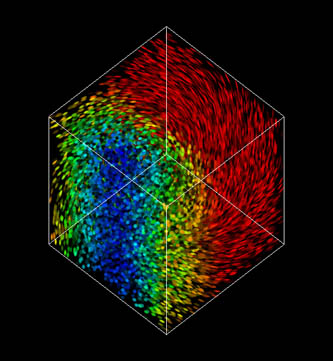
Figure 7: The (normalized) transfer function on top maps vectors with length zero to blue and vectors with maximum length to red to better communicate flow magnitude.
Colour can also be used to better visualize vector directions (as appearing on the viewing plane), which helps to distinguish areas where flow direction vary strongly. Figure 8 uses the transfer function depicted on top, which results in vertical spots being painted blue, and horizontal spots pink.

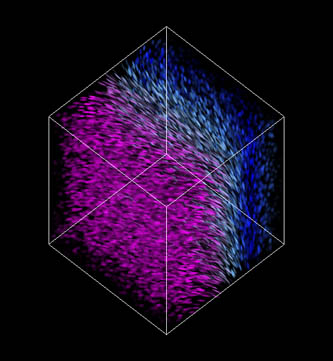
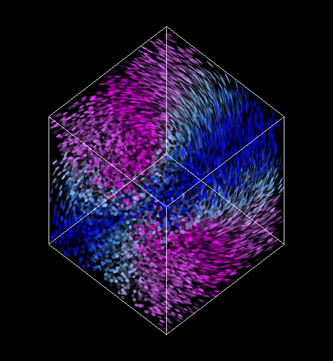
Figure 8: Vertical spots (in the viewing plane) are mapped to blue and horizontal spots to pink.
Using depth cueing, the intensities of the spots are varied according to their distance from the viewing plane. The closer the spots are, the lighter they are drawn. This gives a good three-dimensional impression and helps to better distinguish near and far areas. An example can be seen in Figure 9.
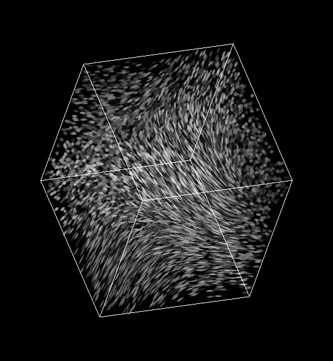
Figure 9: Depth cueing (i.e., spots further away from the viewing plane are drawn darker) further increases the 3D impression.
As mentioned in 3.2, spot noise usually visualizes vector lengths and directions, but does not show the actual vector orientations. Just like in 2D, colours can be used to mark the 'begin' and 'end' of spots. Changing the shape of the spots to a raindrop-like form can further help to enhance this effect. Figure 10 results from two vector fields that contain opposite vector orientations, but are otherwise the same.
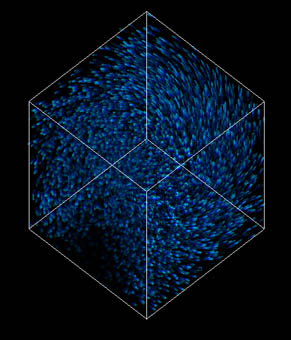
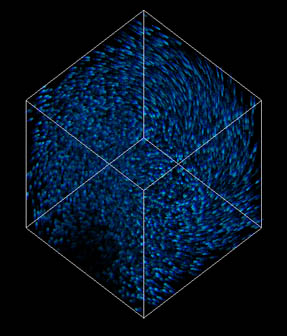
Figure 10: Anisotropic spots in colour and shape can be used to indicate flow orientation.
Here some more results achieved with the methods described in this paper are presented. Figure 11 shows the fast preview mode and a high quality rendering with improved depth perception by sorted spots of the same flow.
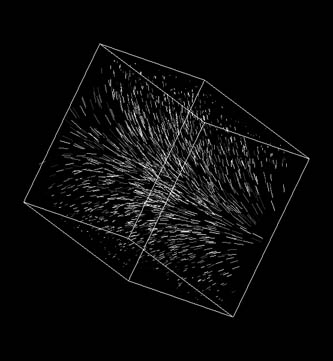
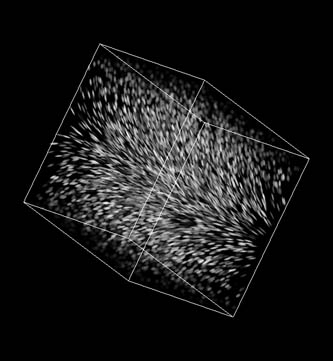
Figure 11: Fast preview of a simple flow, and high quality rendering.
In Figure 12 colour is used to visualize vector directions (as appearing on the screen), and an example of a 3D velocity mask is given, showing only areas with big vector lengths. More information about vector lengths is provided in figure 13 using color coding; also the use of anisotropic, coloured spots is shown, visualizing actual vector orientations.
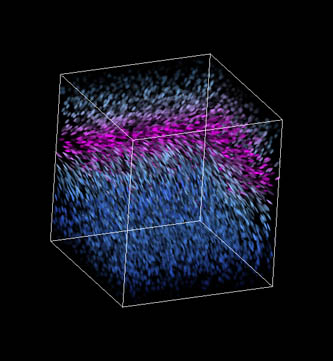
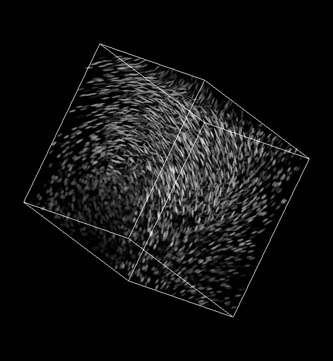
Figure 12: Vector direction information via color coding on the left, 3D velocity mask on the right.
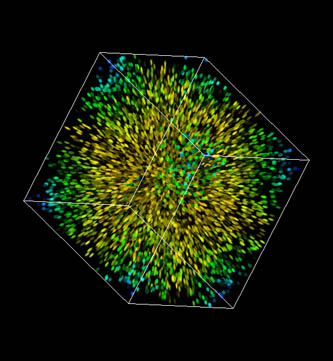
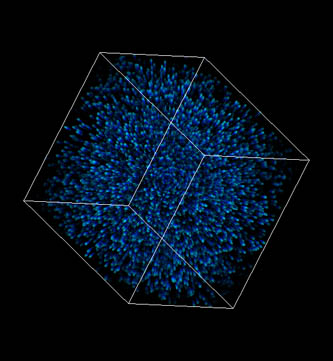
Figure 13: Color coded velocity information on the left, anisotropic spots on the right.
We presented several strategies to improve the quality of visualizations of two- and three-dimensional vector fields via spot noise. The spot noise inherent problem of lacking information about flow orientation can be tackled by anisotropic spots. Thereby, spot density should be kept low so that individual spots can be discerned. Where in 2D a dense representation may be favourable, sparse textures are inevitable in 3D in order to minmize occlusions.
Visualizing 3D vector fields is an inherently much more difficult problem. A first quick impression of the flow can be gained by a fast preview, where simple lines aligned to the direction and scaled according to the magnitude of the flow are placed at random positions with random intesities.
A straightforward extension of spot noise to 3D is, to project vectors at random positions onto the view plane, align and scale the spots according to this vector and draw it with random intensity. However, this results in rather cluttered and confusing images. Better depth impression can be achieved by performing spot noise only within planes and blending them together back-to-front.
Further improvements like a 3D velocity mask, that makes regions of low velocity transparent, colour coding schemes for vector length and direction and depth cueing increase the quality of 3D flow visualizations with spot noise.
This paper is partially based on results of the "Visualization" course at the Institute of Computer Graphics and Algorithms / Vienna University of Technology / Austria. This course was organized by Thomas Theußl, who also helped a lot in the development of the methods and software used for this paper.
Also, parts of this work have been done as part of the VRVis basic research on visualization (http://www.VRVis.at/vis/) at the VRVis Research Center in Vienna, Austria, which is funded by an Austrian research program called Kplus.
[1] M. Brill, H. Hagen, H. Rodrian, W. Djatschin, and S.Klimenko. Stream ball techniques for flow visualization. In Proceedings Visualization '94, pages 225-231, 1994.
[2] B. Cabral and L. Leedom. Imaging vector fields using line integral convolution. In James T. Kajiya, editor, Computer Graphics (SIGGRAPH '93 Proceedings), volume 27, pages 263-272, August 1993.
[3] R. Crawfis and N. Max. Direct volume visualization of three-dimensional vector fields. In Proceedings of 1992 Workshop on Volume Visualization, pages 55-60, 1992.
[4] R. Crawfis and N. Max. Texture splats for 3D scalar and vector field visualization. In Gregory M. Nielson and Dan Bergeron, editors, Proceedings of the Visualization '93 Conference, pages 261-267, San Jose, CA, October 1993. IEEE Computer Society Press.
[5] C. de Leeuw and J. van Wijk. Enhanced spot noise for vector field visualization. In IEEE Visualization '95 Proceedings, pages 233-239. IEEE Computer Society, October 1995.
[6] J. Hultquist. Constructing stream surfaces in steady 3D vector fields. In Proceedings Visualization '92, pages 171-178, Boston, MA, USA, 1992.
[7] V. Interrante and C. Grosch. Strategies for effectively visualizing 3D flow with volume LIC. In Proceedings of Visualization '97, pages 421-424, 1997.
[8] V. Interrante and C. Grosch. Visualizing 3D flow. IEEE Computer Graphics & Applications, 18(4), July - August 1998. ISSN 0272-1716.
[9] B. Jobard, G. Erlbacher, and M. Y. Hussaini. Hardware-accelerated texture advection for unsteady flow visualization. In T. Ertl, B. Hamann, and A. Varshney, editors, Proceedings Visualization 2000, pages 155-162. IEEE Computer Society Technical Committee on Computer Graphics, 2000.
[10] B. Jobard and W. Lefer. Creating evenly-spaced streamlines of arbitrary density. In W. Lefer and M. Grave, editors, Visualization in Scientific Computing '97, Eurographics, pages 43-56. Springer-Verlag Wien New York, 1997.
[11] N. Max, R. Crawfis, and C. Grant. Visualizing 3D velocity fields near contour surfaces. In R. Daniel Bergeron and Arie E. Kaufman, editors, Proceedings of the Conference on Visualization, pages 248-256, Los Alamitos, CA, USA, October 1994. IEEE Computer Society Press.
[12] H. Pagendarm and B. Walter. Feature detection from vector quantities in a numerically simulated hypersonic flow field in combination with experimental flow visualization. In R. Daniel Bergeron and Arie E. Kaufman, editors, Proceedings of the Conference on Visualization, pages 117-123, Los Alamitos, CA, USA, October 1994. IEEE Computer Society Press.
[13] C. Rezk-Salama, P. Hastreiter, C. Teitzel, and T. Ertl. Interactive exploration of volume line integral convolution based on 3D-texture mapping. In David Ebert, Markus Gross, and Bernd Hamann, editors, IEEE Visualization '99, pages 233-240, San Francisco, 1999. IEEE.
[14] A. Sanna, B. Montrucchio, P. Montuschi, and A. Sparavigna. Visualizing vector fields: the thick oriented stream-line algorithm (TOSL). Computers & Graphics, 25(5), October 2001.
[15] J. van Wijk. Spot noise-texture synthesis for data visualization. In Thomas W. Sederberg, editor, Computer Graphics (SIGGRAPH '91 Proceedings), volume 25, pages 309-318, July 1991.
[16] R. Wegenkittl and E. Gröller. Fast oriented line integral convolution for vector field visualization via the Internet. In Roni Yagel and Hans Hagen, editors, Proceedings of the 8th Annual IEEE Conference on Visualization (VISU-97), pages 309-316, Los Alamitos, October 19-24 1997. IEEE Computer Society Press.
[17] L. Westover. Footprint evaluation for volume rendering. Computer Graphics (SIGGRAPH '90 Proceedings), 24(4):367-376, August 1990.
[18] M. Zöckler, D. Stalling, and H. Hege. Interactive visualization of 3D-vector fields using illuminated streamlines. In Proceedings of IEEE Visualization '96, San Francisco, pages 107-113, October 1996.