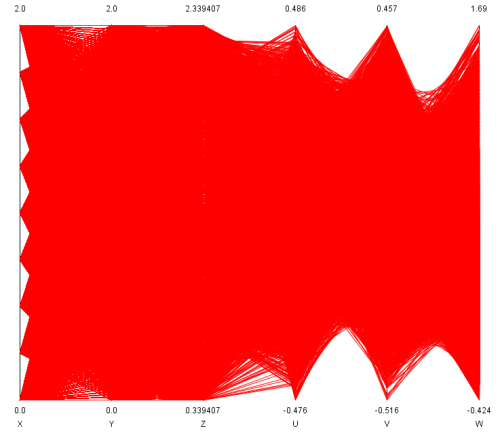
Figure 1: |
A parallel coordinates visualization of UVW dataset holding 149 769 data items defined in 6 dimensions. |
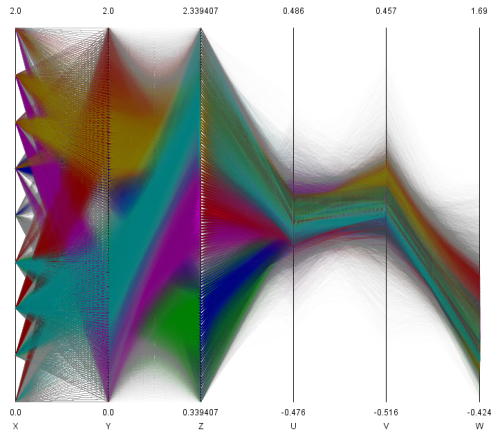
Figure 2: |
A parallel coordinates visualization of UVW dataset holding 149 769 data items defined in 6 dimensions. The result of a fuzzy k means clustering was incorporated by mapping the maximum membership of a data item to the transperancy. The color of objects is defined as mixture of cluster colors weighted by the corresponding membership values. |
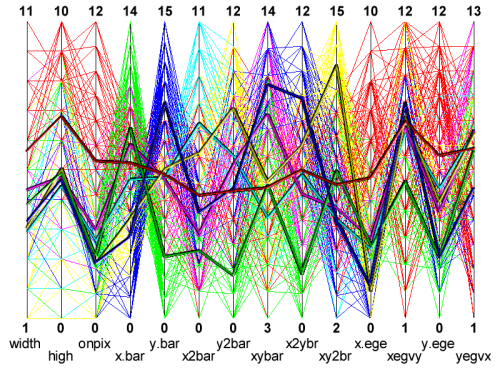
Figure 3: |
Clustering result in parallel coordinates |
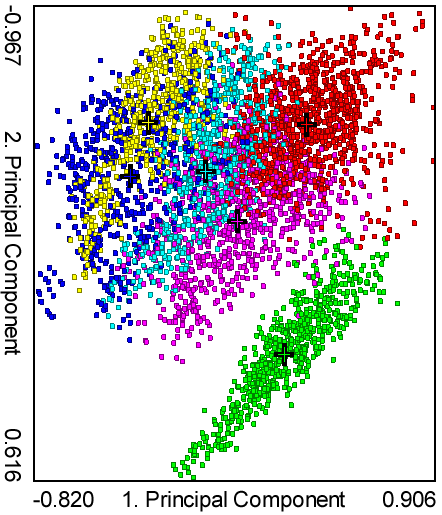
Figure 4: |
Clustering result mapped on principal components |
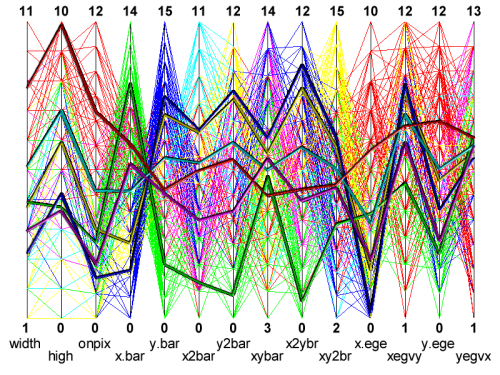
Figure 5: |
Repositioned cluster centers in parallel coordinates |
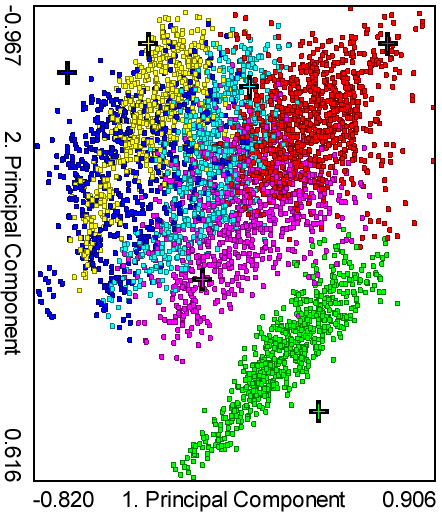
Figure 6: |
Repositioned cluster centers in principal components |
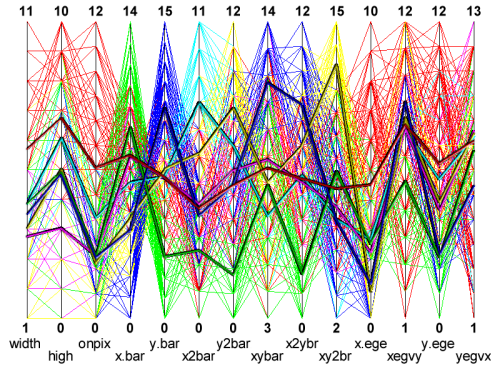
Figure 7: |
Reclustering result in parallel coordinates |
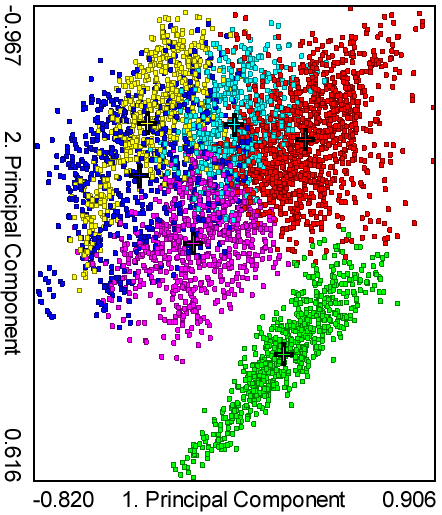
Figure 8: |
Reclustering result mapped on principal components |